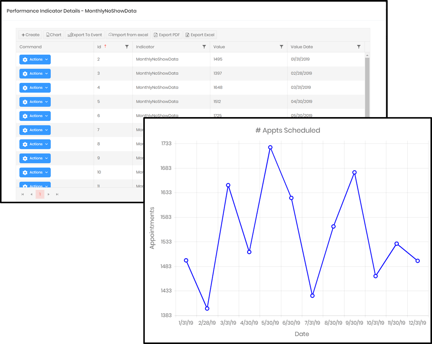
Create performance indicators that belong to each program for tracking over time. Enter data on an ongoing basis or import data from excel spreadsheets and publish charts for specified time periods.
Time periods can be days, weeks, months, or years; whatever your particular indicator calls for.
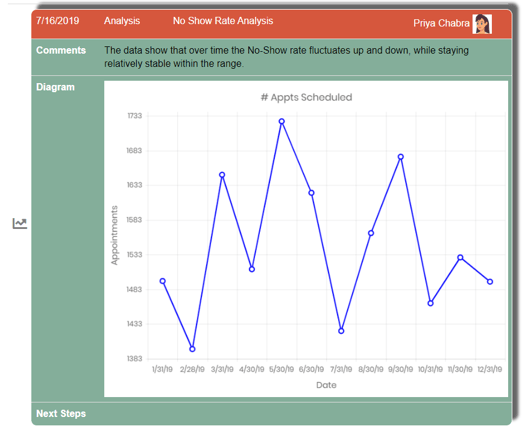
Performance indicators can be exported to image files, or saved directly into events for additional comments. Events with embedded charts will publish to project SmartStory™ for high impact visual narratives.
Already using another systems for analytics and reporting? Perfect, you can upload images in place of numbers to memorialize your key performance indicators and document your analysis.
When KPI's are used in Events they are available to publish to the SmartStory™ narrative. Whether analyzing data, or reporting on improved performance, visual analytics provide powerful and easy to read insights into your programs and project performance.